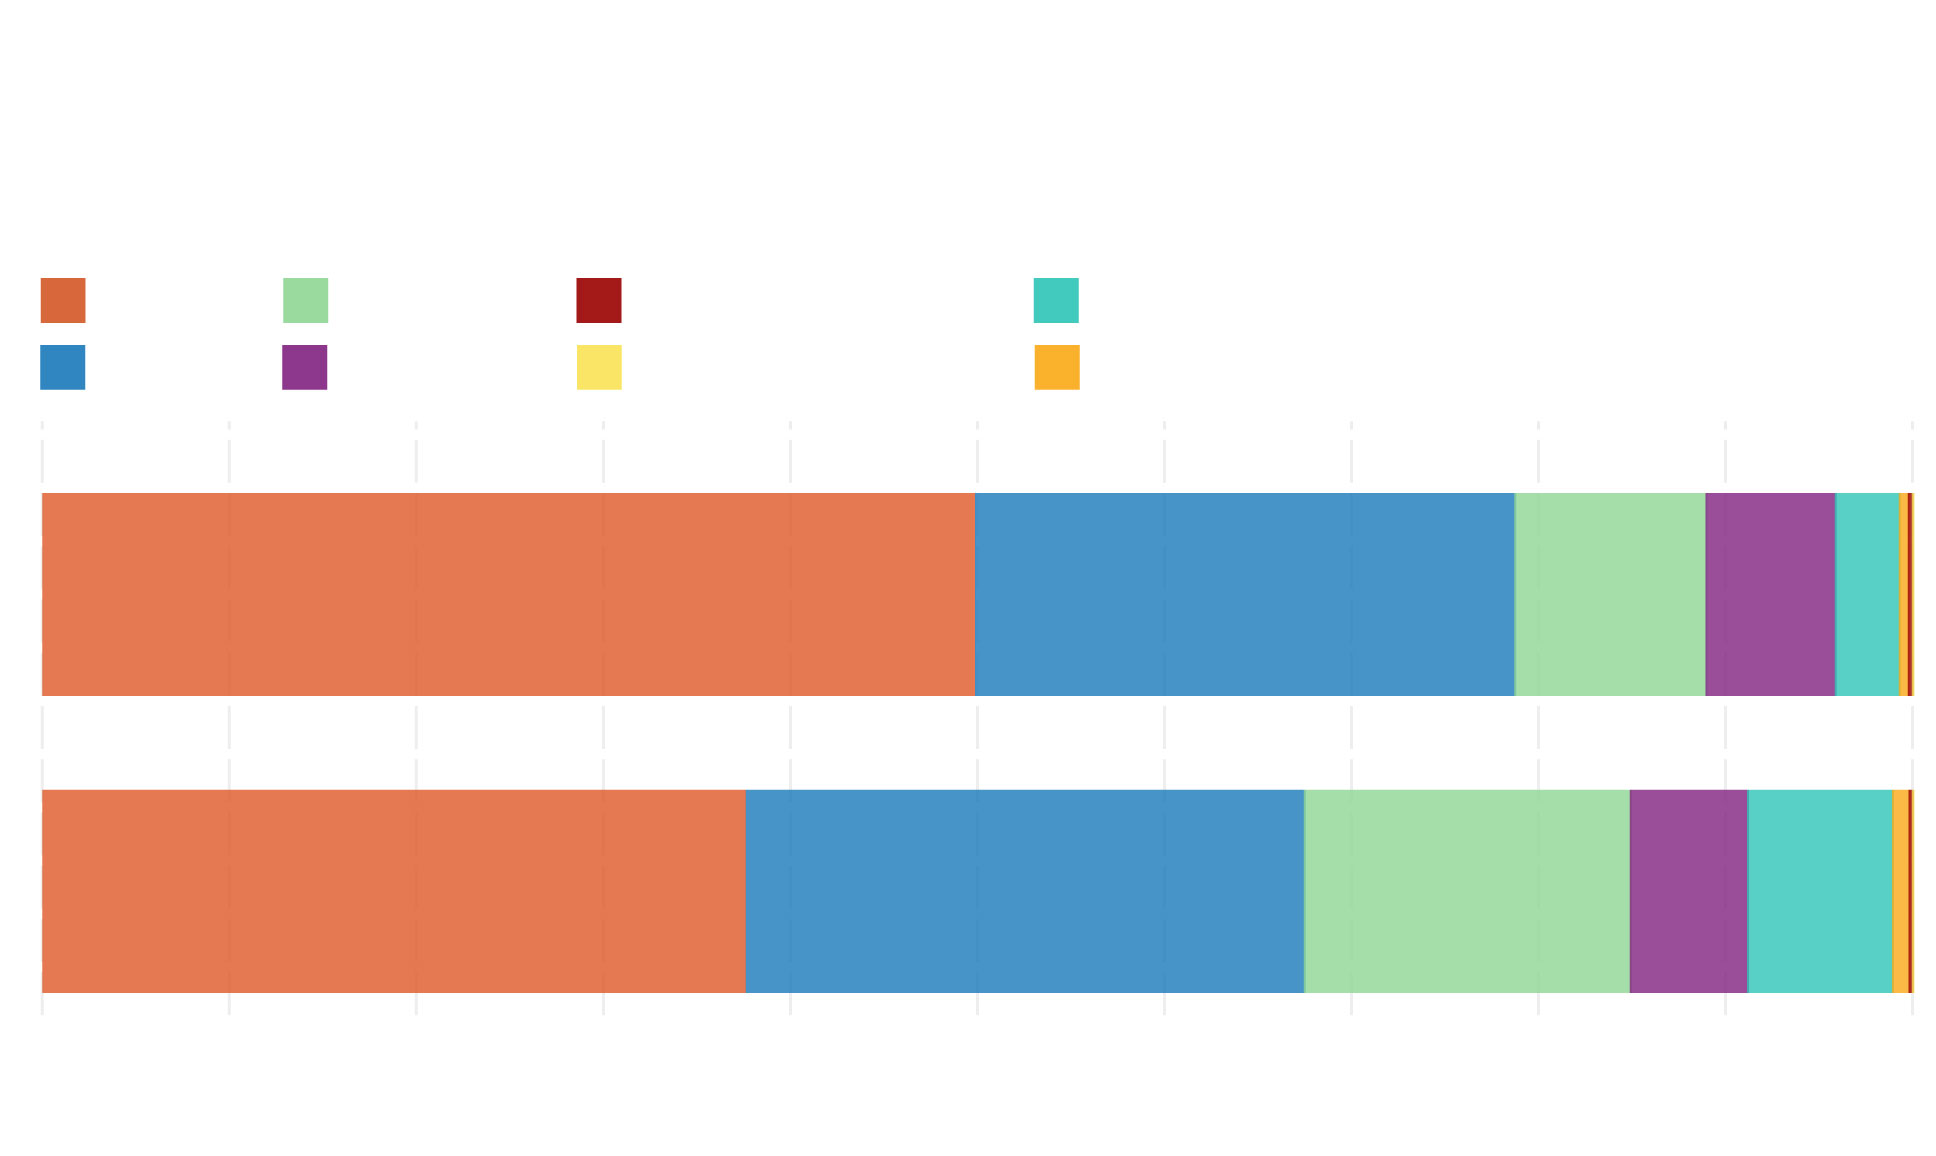
Percent population by race and age in Maryland
Maryland’s changing demographic are driven by people under age 18, over 60% of whom are of color.
BY AADIT TAMBE | CAPITAL NEWS SERVICE
White
Hispanic
American Indian
Two or more
Black
Asian
Pacific Islander
Other
Percent of population 18 and over
Percent of population under 18
100%
10
20
30
40
50
60
70
80
90
0
Source: CNS Analysis of 2020 and 2010 Redistricting Data (P.L. 94-171)
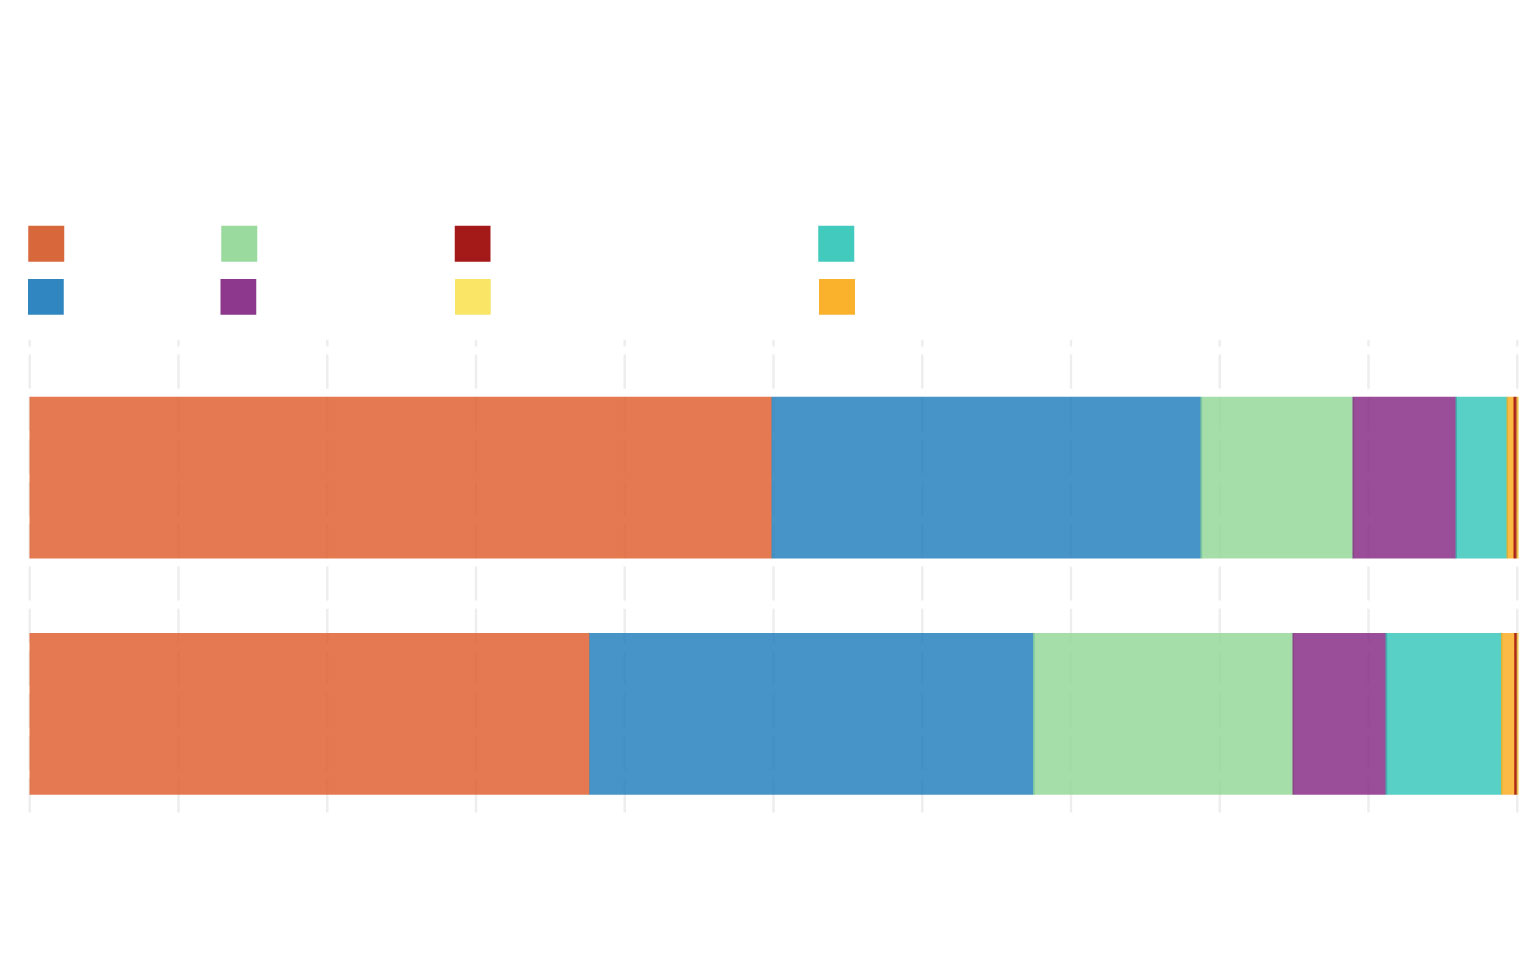
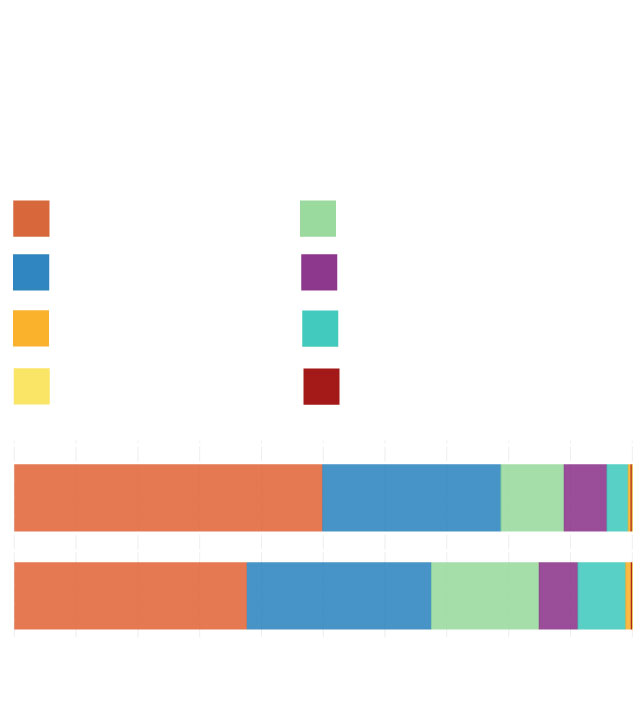
Percent population by race and age in Maryland
BY AADIT TAMBE | CAPITAL NEWS SERVICE
Maryland’s changing demographics are driven by people under age 18, over 60% of whom are of color.
White
Hispanic
Black
Asian
Other
Two or more
Pacific Islander
American Indian
Percent of population 18 and over:
Percent of population under 18:
100%
10
20
30
40
50
60
70
80
90
0
Source: CNS Analysis of 2020 and 2010 Redistricting Data (P.L. 94-171)
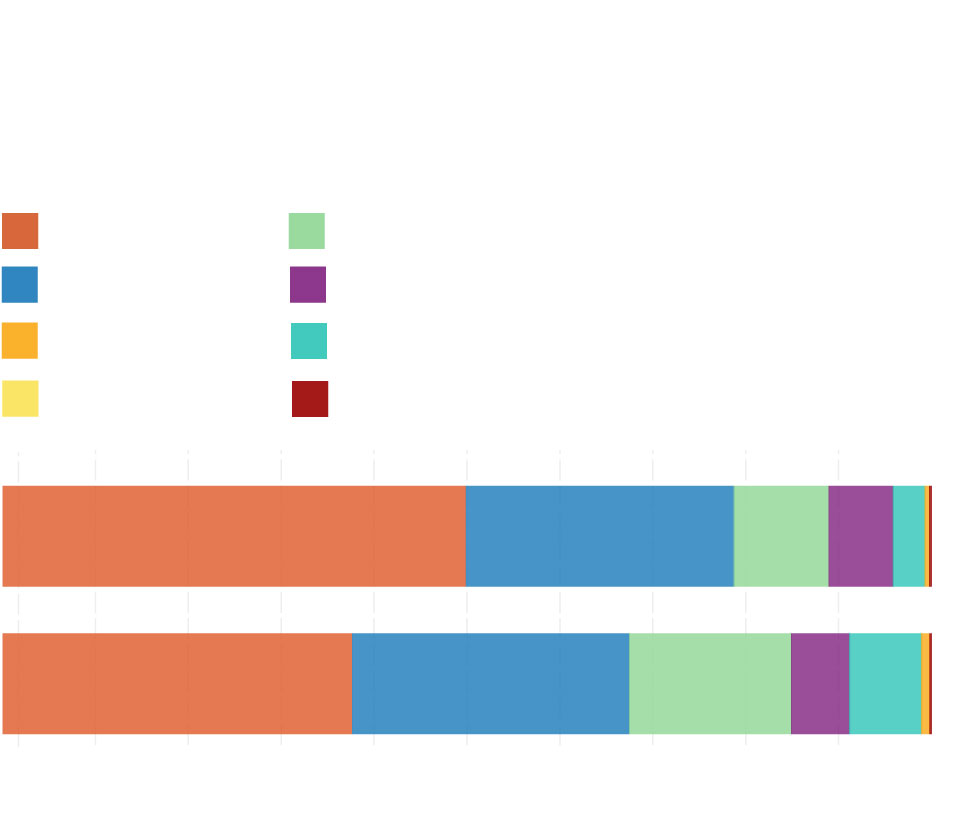
Percent population by race and age in Maryland
BY AADIT TAMBE | CAPITAL NEWS SERVICE
Maryland’s changing demographics are driven by people under age 18, over 60% of whom are of color.
White
Hispanic
Black
Asian
Other
Two or more
Pacific Islander
American Indian
Percent of population 18 and over
Percent of population under 18
100%
10
20
30
40
50
60
70
80
90
0
Source: CNS Analysis of 2020 and 2010 Redistricting Data (P.L. 94-171)